
Author: Dee Kiczek

10 High-Impact Energy Insights Hidden in Your Utility Bills

Utility bills are often treated as static documents, something to pay and file away.

In reality, they contain a continuous stream of operational, financial, and performance data. When analyzed correctly, that data can uncover cost savings, identify inefficiencies, and guide investment decisions across your entire building portfolio.

Below are ten real insights derived directly from utility bill analysis, each tied to measurable impact:

1. You May Be Locked into the Wrong Utility Rate

A single spike in peak demand can push a building into a higher rate class and keep it there long after the spike is gone. In many cases, this happens automatically and goes unnoticed, quietly increasing costs month after month. Without ongoing review, buildings can remain misclassified indefinitely.

Example:

A building exceeded 50 kW demand for three consecutive months three years prior and remained in a higher rate structure.

Impact:

Unnecessary cost premiums every billing cycle.

Opportunity:

Rate review and reclassification can immediately reduce spend without operational changes. Many organizations never revisit their rate classification after an initial change, meaning they continue overpaying by default. Regular audits ensure your rate structure reflects current usage, not historical conditions.

2. Your ENERGY STAR Score May Be Underreported

Building performance scores are only as accurate as the data collected. Even small data gaps or outdated inputs can prevent a building from reaching its true performance potential. This creates missed opportunities for recognition, incentives, and competitive positioning.
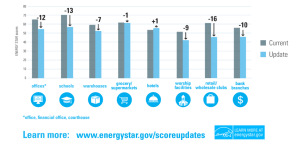
Example:

A building with a score of 73 actually qualified for a 76 after updating attributes, crossing the threshold for certification.

Impact:

Missed certification opportunities and reduced asset valuation.

Opportunity:

Routine data validation can unlock compliance and recognition benefits. Small inaccuracies in square footage, occupancy, or operating hours can materially impact scores. Keeping this data current ensures performance is properly reflected and recognized.

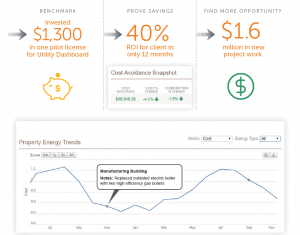
3. Energy Projects Reveal Their True ROI in Billing Data

Utility bills provide the most objective validation of energy project performance. They eliminate assumptions and show exactly how improvements translate into financial outcomes over time. This makes them one of the most reliable sources for measuring success.

Example:

A controls upgrade delivered $4,600 savings in its highest-performing month and $73,000 total savings over 15 months.

Impact:

Clear ROI tracking and vendor accountability.

Opportunity:

Use billing data to validate and optimize energy improvement investments. This level of visibility allows teams to confirm whether projected savings are actually realized. It also creates a feedback loop to improve future project selection and execution.

4. Weather Normalization Exposes Hidden Inefficiencies

Energy usage should correlate with weather patterns. When it does not, something is off. Without adjusting for actual weather conditions, it is easy to misinterpret performance and overlook underlying operational issues. Normalization provides the context needed to separate true inefficiencies from seasonal variation.
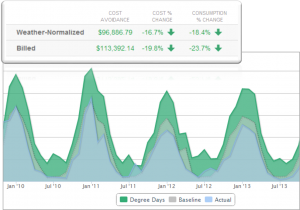
EnergyPrint Weather Normalized Cost Avoidance

Example:

A winter that was 6% warmer still resulted in a 7% increase in utility costs.

Impact:

Undetected inefficiencies, often tied to system settings or overrides.

Opportunity:

Identify and correct operational issues like HVAC setpoints. Without normalization, these issues can be mistaken as seasonal variability. Comparing usage against weather-adjusted expectations makes anomalies easier to detect and resolve.

5. Demand Charges May Be Driving a Disproportionate Share of Costs

Many building owners underestimate the impact of demand charges. These costs are often less visible than consumption charges but can represent a significant portion of total spend. Without actively monitoring peaks, they can escalate quickly.

Example:

A hospital spent 40% of its utility costs on demand, well above national and state benchmarks.

Impact:

Significant cost exposure tied to peak usage patterns.

Opportunity:

Demand management strategies can yield immediate and recurring savings. Even small reductions in peak demand can have outsized financial impact. Understanding when and how peaks occur is the first step to controlling them.

6. The Highest Energy Users Are Not Always the Best ROI Targets

Energy consumption alone does not determine where to invest. Focusing only on usage can lead to missed opportunities where cost inefficiencies are actually higher. A more strategic approach considers both rate structures and cost intensity.

Example:

Three buildings were identified as top retrofit candidates not due to usage, but because their utility rates were 50% higher than others in the portfolio.

Impact:

Misallocated capital if decisions are based on usage alone.

Opportunity:

Prioritize projects based on cost intensity, not just consumption. This approach ensures capital is directed where it will generate the highest return. It also prevents overlooking smaller buildings that may have disproportionate cost inefficiencies.

7. Completed Projects May Be Underperforming

Installation alone does not guarantee results. Without baseline and post-implementation tracking, underperformance can persist unnoticed and erode expected returns. Verification is critical to ensure projected savings are actually achieved.

Example:

An LED upgrade reduced consumption by 9%, below expected ROI targets.

Impact:

Missed savings projections and unclear accountability.

Opportunity:

Ongoing monitoring enables course correction and vendor alignment. Without post-installation tracking, underperformance can go unnoticed for years. Continuous validation ensures projects deliver on their financial promise.

8. Time-of-Use Rates Can Unlock Immediate Savings

Utility pricing often depends on when energy is used, not just total consumption. Many buildings already operate in patterns that align with more favorable rate structures but never take advantage of them.

Example:

A building operating primarily during weekdays benefited from switching from a general service rate to a time-of-day structure.

Impact:

Lower cost per kWh without reducing usage.

Opportunity:

Align rate structures with operational patterns. Many buildings already operate in ways that qualify for more favorable rates. Identifying and switching to those structures can produce immediate savings without operational disruption.

9. Policy and Tax Changes Directly Affect Energy Costs

Utility bills reflect regulatory and policy shifts in real time. These changes can impact costs quickly, often without clear visibility into the cause. Staying ahead of them is critical for accurate forecasting and budgeting.

Example:

The expiration of a tax credit led to a projected 2% increase in gas costs.

Impact:

Unexpected cost increases without proactive planning.

Opportunity:

Forecast and budget more accurately with policy-aware analysis. Tracking these changes allows organizations to anticipate cost shifts rather than react to them. It also helps inform longer-term financial and operational planning.

10. Compliance Can Be Completed Earlier than Expected

Energy benchmarking and compliance do not need to be last-minute efforts. With the right data infrastructure and tracking in place, compliance can become a continuous process rather than a periodic scramble. This reduces risk and improves operational efficiency.

Example:

A client achieved compliance three months ahead of deadline.

Impact:

Reduced risk, improved reporting timelines, and better resource allocation.

Opportunity:

Centralized data tracking simplifies compliance across portfolios. Early completion reduces the risk of penalties and last-minute scrambling. It also frees up internal teams to focus on higher-value initiatives.

What This Means for Building Owners

Utility bills are not just records. They can be a powerful diagnostic tool.

Across EnergyPrint client portfolios, consistent utility bill analysis has delivered an average second-year savings of 12.7%, driven by:

  • Rate optimization
  • Demand reduction
  • Operational adjustments
  • Targeted capital investments

The key difference is not just access to data, it’s the ability to interpret and act on the delivered insights at scale.

Take the Next Step

If your utility bills are not actively driving decisions, they are leaving money on the table. Most organizations already have the data they need, but lack the systems and processes to turn it into action. That gap is where the biggest savings opportunities exist.

Connect with our solutions team to identify cost-saving opportunities across your buildings and turn utility data into measurable ROI.

EnergyPrint and Wiegmann Associates Form Joint Venture to Deliver Performance-Based Energy Efficiency Upgrades

SAINT PAUL, MN: EnergyPrint, a St. Paul energy analytics software company, has formed a joint venture with Wiegmann Associates, a national design-build contractor specializing in commercial building efficiency. This partnership enables Wiegmann to monitor project performance in real time using EnergyPrint’s AI-enabled continuous re-commissioning software.

Through this joint venture, EnergyPrint will offer Wiegmann’s design-build efficiency upgrades to its existing clients at “net-zero” prices, meaning efficiency projects are funded through energy savings. EnergyPrint analytics reports ensure that projected savings exceed the monthly amortization of project costs, allowing efficiency improvements to generate positive cash flow without requiring up-front investment.

Wiegmann CEO Gerry Wiegmann explained the synergy behind the venture: “We always project savings to our customers. This venture with EnergyPrint will verify results at the utility meter and use new AI software to monitor HVAC system performance in real time. This will assure savings are persistent, continuously re-commissioning our client’s buildings.”

Wade Smith, CEO of EnergyPrint, added, “EnergyPrint has been advising our customers for 15 years, whose average second year savings has been 12.7%. Now, working through Wiegmann, we will be doing much more than simply measuring results and advising clients – we will offer to design, install, and continuously re-commission efficiency measures.”

If you are interested in exploring the feasibility of “net-zero” cost energy efficiency upgrades in your buildings, please get in touch.

EnergyPrint developed its utility data analytics platform in 2009 along with the building professionals who became its first clients. Today, EnergyPrint’s solutions are setting the standard for monetizing energy savings. They work directly with utility companies and custom-built in-house AI solutions to gather, input, and validate data. This administrative solution significantly reduces time and engineering expenses for building owners and the professionals who serve them. EnergyPrint seamlessly integrates its data services and web application into customers’ businesses, powering solutions that reduce the energy footprint of commercial buildings across North America. EnergyPrint is an ENERGY STAR® partner.

Wiegmann Associates has focused on innovative, energy-saving and cost-effective HVAC solutions since 1995. Today, Wiegmann is one of the industry’s premier national design-build mechanical contractors and an expert in value engineering. They know how to engineer and construct HVAC systems whose price and performance they can guarantee. Over the years, Wiegmann has saved clients in 42 states millions of dollars, both in first-cost expenses and in energy consumption, which reduces operating costs year over year.

Purpose in the Data: Wellbeing Ignites Welldoing Podcast

EnergyPrint CEO Wade Smith and Diversys CEO Roger Barlow were recently interviewed by the Wellbeing Ignites Welldoing podcast produced by the Global Wellbeing Council.

In the episode, titled “Purpose in the Data”, the following topics were covered:

✅ What ESGs truly represents and how it impacts wellbeing
✅ Lessons from building cultures where wellbeing and integrity are inseparable
✅ What leaders can do to advance sustainability

Listen to the full episode →

Spotify: https://lnkd.in/gYwjtvtM
Apple Podcasts: https://lnkd.in/eBiZ5mtw

Ready to see how EnergyPrint can transform your energy data into purpose? Schedule a discovery call to learn more.

Energy Benchmarking for Compliance, Data, and Building Performance

Chicago

Benchmarking for Compliance, Data, and Performance

Energy benchmarking has become a standard requirement for commercial and other large buildings across the United States. What started as a transparency initiative is now a core operational responsibility for building owners and managers. 

Benchmarking is an ongoing process that supports compliance, cost control, and long-term performance improvement. Understanding how it works and what’s required can help you ensure compliance the first time and avoid the challenging resubmission process.

What is energy benchmarking?

At its core, energy benchmarking is the practice of tracking a building’s energy and water use over time and reporting that data through EPA’s ENERGY STAR Portfolio Manager. Most local and state benchmarking ordinances require owners to submit at least 12 consecutive months of utility data on an annual basis.

This data creates a baseline for understanding how a building performs compared to itself year over year and against similar buildings nationwide. Without that baseline, it is nearly impossible to validate whether energy projects, operational changes, or building investments are actually reducing costs.

Benchmarking turns utility bills into usable data that enables informed decision making around energy conservation and cost saving efforts.

Why Benchmarking Requirements Keep Expanding

Governments continue to expand benchmarking requirements for a simple reason: buildings account for roughly 40% of total energy consumption in the United States. Benchmarking programs give cities and states visibility into energy usage patterns while giving owners a structured way to identify inefficiencies and reduce waste.

For building owners, compliance is mandatory. But the data collected can also support broader goals such as operating expense reduction, asset value preservation, sustainability reporting, and tenant transparency.

Navigating Benchmarking Compliance

Benchmarking sounds straightforward on paper, but execution is where many companies struggle.

Common issues include:

  • Delays in obtaining complete and accurate utility data
  • Properties being rejected due to data gaps or quality checker errors
  • Missed deadlines because of follow-up delays
  • Rejected submissions that require appeals or resubmission
  • Managing different requirements across multiple jurisdictions

Benchmarking is not necessarily limited to a single submission. It often involves multiple rounds of validation, corrections, and communication with utility companies and jurisdictions. This follow-up burden is one of the biggest pain points for companies we work with, especially when their portfolios span multiple cities or states.

Why Rejections Happen and What to Do

Rejections are common and are usually tied to incomplete data, incorrect property setup, or failed data quality checks in Portfolio Manager. Without a clear process, rejections can create operational challenges, as well as compliance risk.

Appeals and resubmissions take time, and missing deadlines can result in penalties or public non-compliance listings.

In some cases, buildings may qualify for temporary exemptions or extensions, but those require formal appeals and documentation. This is where a managed benchmarking approach becomes critical.

Turning Benchmarking Into Proof of ROI

Beyond compliance, benchmarking provides the foundation for proving a positive return on investment for energy initiatives. Once a baseline is established, owners can measure performance using year-over-year comparisons or project-specific analysis.

When combined with tools like cost avoidance and weather normalization, benchmarking data can show whether savings are real, sustained, and tied to specific actions. This removes guesswork and allows stakeholders to evaluate projects based on actual utility cost outcomes, not estimates.

If savings do not show up on the utility bill, they are not savings. Benchmarking makes that clear.

How EnergyPrint Simplifies the Process

EnergyPrint manages the full benchmarking lifecycle, not just the submission itself.

Our benchmarking solution includes:

  • Collecting and validating utility data directly from providers
  • Setting up and maintaining Portfolio Manager properties correctly
  • Running and resolving data quality checks
  • Submitting reports to required city and state portals
  • Managing follow-up, rejections, appeals, and resubmissions
  • Keeping portfolios compliant year after year as requirements change

For building owners and managers, this removes the operational burden while ensuring accuracy and consistency across properties.

Benchmarking is an Ongoing Operational Process

Benchmarking is not a single deadline you need to meet. It’s an ongoing operational requirement that, when handled correctly, provides insight into building performance and energy costs over time.

As more jurisdictions adopt benchmarking and disclosure laws, having a repeatable, reliable process matters. The organizations that treat benchmarking as a managed solution rather than an annual obligation are the ones that stay compliant, reduce risk, and extract real value from their data.

EnergyPrint helps building owners do exactly that, across Minnesota and nationwide. To understand your local benchmarking requirements and ensure your properties are fully compliant, schedule a free audit.

From Meter to Market: Turning Utility Data into Strategic Value

EnergyPrint’s CEO Wade Smith was recently featured on the Edge of Intelligence podcast in an episode titled “From Meter to Market: How EnergyPrint Turns Utility Data into Strategic Value”.

Wade shares what it takes to accurately process over 12,000 utility invoices every month and how EnergyPrint achieves 99.45% data accuracy without increasing headcount. The conversation explores how to use smart energy analytics to deliver actionable utility insights while maintaining data integrity at every step.

The discussion also highlights the value of benchmarking how it can be powerful in enabling companies to identify opportunities for improvement by comparing their energy consumption to other similar buildings.

Whether you’re focused on operational efficiency, data integrity, saving money, or developing a smarter energy strategy, this conversation offers valuable insights into the future of utility data management.

Watch the full episode here →

Ready to see how EnergyPrint can transform your energy data into strategic value? Schedule a discovery call to learn how EnergyPrint turns utility data into strategic value.